With data shaping the marketing and sales strategies, you can confidently guide your company's growth. And what better way to achieve this than by leveraging the powerful Salesforce reports? These reports are designed to offer data-driven insights, allowing you to enhance and refine your marketing and sales strategies over time.
Salesforce Reporting Essentials
Salesforce Reports are powerful tools that enable users to analyze and visualize data stored in their Salesforce CRM. These reports provide a comprehensive view of your organization's data, helping you understand your business performance, track key metrics, and make data-driven decisions. You can gather data from multiple sources, apply filters, group and sort data, and create informative charts and graphs.
Types of Salesforce Reports
Salesforce provides different types of reports to cater to various reporting requirements. Here are the most commonly used report types:
- Tabular: Present data in a simple, table-like format. They are ideal for analyzing detailed information and can include both standard and custom report fields.
- Summary: Provide grouped data with subtotals and grand totals. They allow you to summarize data based on specified criteria and quickly understand the overall picture.
- Matrix: Offer a cross-tabular view of data, presenting it in rows and columns. They provide a summarized view with both grouped and aggregated data, allowing for easy comparison.
- Joined: Combine data from multiple report types into a single report. This enables you to analyze data from different sources or objects within Salesforce and gain comprehensive insights.
- Dashboard: Offer a visual representation of your contacts and other assets using charts, graphs, and tables. They provide an at-a-glance view of key metrics and allow users to interact with the data.
Quick Steps to Creating and Customizing Reports
To create effective Salesforce Reports, follow these steps:
-
Choosing Report Type: Begin by selecting the appropriate report type based on your reporting needs. Consider the type of data you want to analyze and the insights you want to gain.
-
Selecting Report Fields: Choose the relevant report fields that provide the necessary information for your analysis. You can include standard fields, custom fields, and even formulas to calculate derived values.
-
Applying Filters: Apply filters to narrow down the data and focus on specific criteria. Filters help you refine your report and extract the most relevant insights.
-
Grouping and Sorting Data: Grouping and sorting data allow you to organize your report and analyze data at different levels of granularity. You can group data by various attributes and sort it based on specific criteria.
-
Adding Charts and Graphs: Enhance your report's visual appeal and communicate insights effectively by adding charts and graphs. Choose the appropriate visualization types based on the data you want to represent.
6 Salesforce Reports for Revenue Teams
Salesforce reports can make your Customer Relationship Management (CRM) data talk. They allow you to understand who your best-fit customers are, where your best-fit leads are coming from, how different types of prospects are moving through your marketing and sales process, the velocity of your marketing-sales funnel and more.
Here, we delve into the details of six crucial Salesforce reports your revenue team should be using to optimize your business growth.
1. Leads Generated by Month and Their Qualification
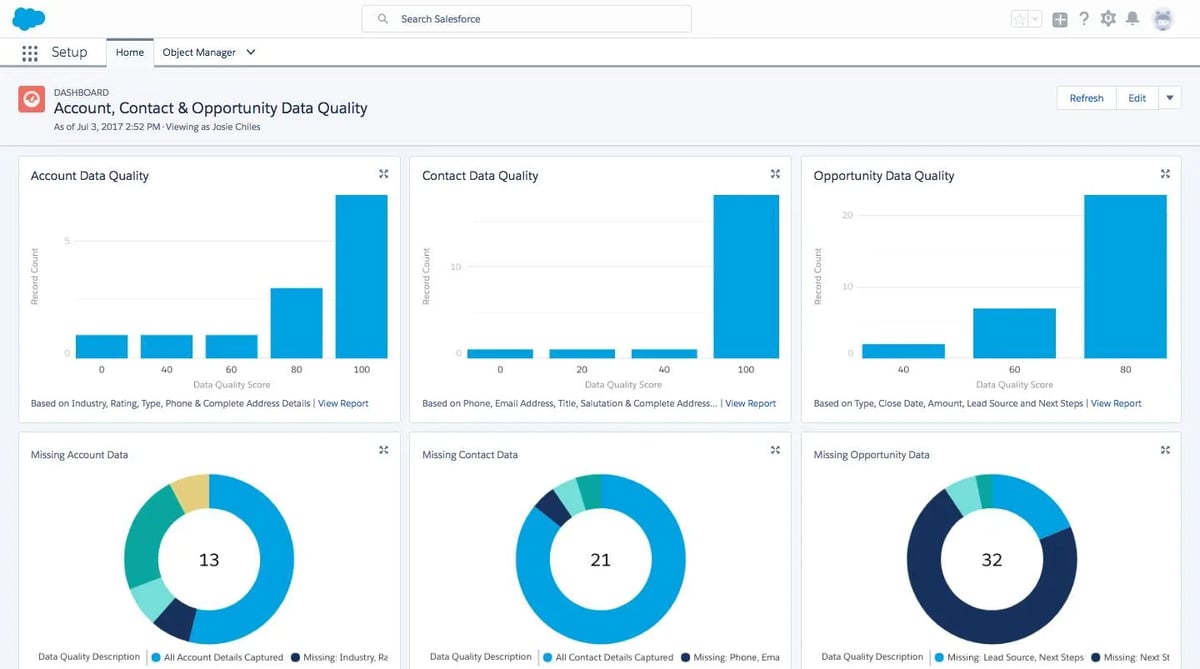
How many leads were generated month-over-month, and what percentage of those are qualified?
You want to look at both volume and quality at once because it gives you the best sense of what success actually looks like. If you’re just looking at one factor or the other, you won’t have a full understanding of how you’re tracking toward your lead creation goal.
Are the activities you’re doing attracting the right people, and are you attracting enough of them to hit your goals further down the funnel? Or are you seeing a decreasing number of qualified leads being produced from the same quantity of leads being converted?
2. Opportunities Created Month Over Month and Their Value
How many opportunities are you creating month over month in terms of both number of accounts and dollar value? What do those numbers look like on an individual or team basis?
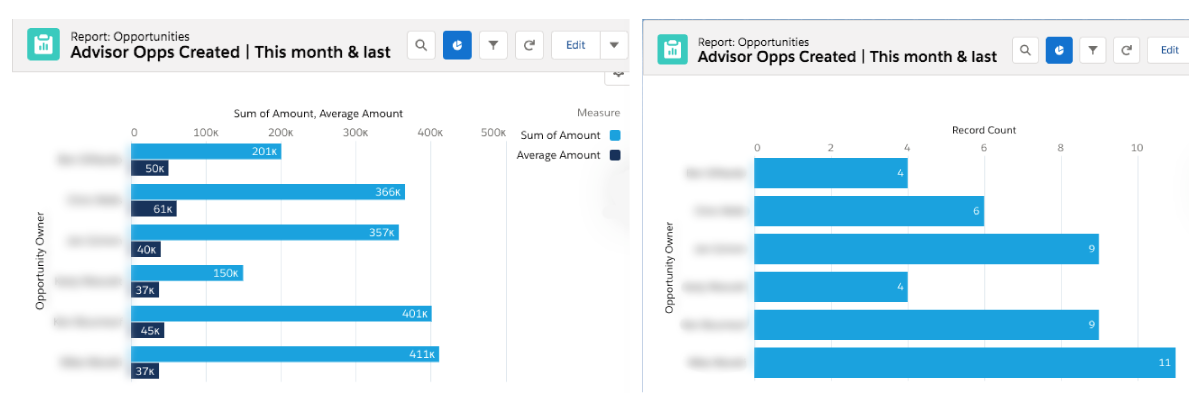
Unlike the number of leads generated per month, this report can just focus on quantitative data — after all, for a prospect to become an opportunity, they need to be high quality
Knowing the number of opportunities you’re creating in combination with your opportunity-to-closed-won win rate allows you to start creating sales forecasts. For example, if you know your win rate is pretty consistently 30%, and your team created 20 opportunities in a month, you can safely assume that six of those will close. Being able to predict the number of customers and amount of revenue you’ll have coming in will help your company make other business decisions, like hiring.
3. Opportunities by Campaign
Which campaigns are driving the most won opportunities?
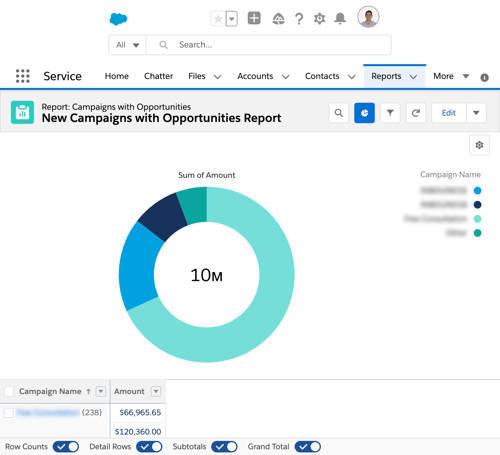
This helps you understand which marketing initiatives are contributing to the most won pipeline, which in turn can help you determine what tactics to invest more resources in and what activities you should stop doing.
For example, you might use campaigns to track the events you participate in. Then, as the contacts you created from those events start to close, you can see if you’re generating a return on investment (ROI) and should continue attending those events in future years.
4. Marketing-Sourced Revenue Generated
What percentage of your revenue is being sourced from marketing as opposed to through outbound and referrals?
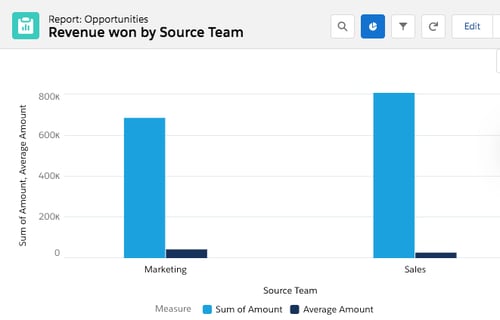
The benchmark for marketing-sourced revenue is 25–30% according to research from Sales Benchmark Index, and knowing how you’re tracking toward that benchmark can help you understand how impactful your inbound strategy is. You can correlate the success of your inbound program with how much revenue marketing is generating.
While this report isn’t as granular as multi-touch marketing attribution, it will help you prove the ROI of your marketing team as a whole.
5. Closed-Lost Opportunities by Reason
What are the reasons prospects are choosing another solution over yours?
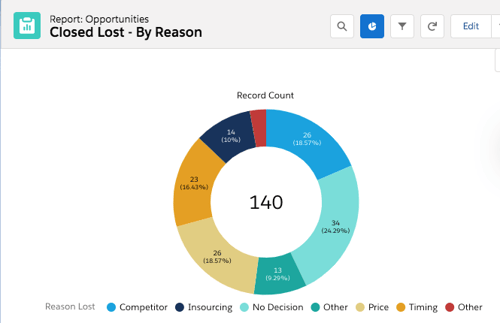
When analyzing this report, it can be helpful to look at it in the context of multiple timelines. What was the biggest closed-lost reason for the past year? What about in the past 90 days?
Understanding the long-term closed-lost trends will indicate which larger strategies you need to start evaluating. Looking at this on the short-term, on the other hand, can help you fix some issues immediately before they turn into long-term trends.
The more specific your property values are, the better your report will be. For example, if your options include both “competitor” and “price,” what should reps select when they lose to a competitor because of price? That ambiguity can make it more difficult to take action based on this report’s findings.
6. Closed-Won and Closed-Lost Opportunities by ICP or Persona
Out of all opportunities that were closed-won or closed-lost over a given period of time, which ideal customer profiles (ICPs) or buyer personas fell where?

Answering this question will help your marketing and sales teams know who your best-fit buyers are and validate your profiles. If you’re seeing a significantly higher loss rate with one ICP, maybe those types of companies aren’t as good of a fit as you initially thought.
These insights will help marketing know who to target and sales know who to prioritize.
Incorporating Salesforce Reports into Your Revenue Strategy
Salesforce reports can significantly impact your revenue strategy. However, the utility of these reports is dependent on data integrity. If the data in your CRM isn’t accurate and up-to-date, these reports won’t be able to provide accurate findings. Hence, it’s crucial that your marketing and sales teams stay vigilant in updating contact properties.
And while Salesforce reports are powerful tools for shaping your strategy, the possibilities become even more potent when you bring HubSpot into the mix. HubSpot CRM is renowned for its intuitive user interface and powerful integrative capabilities, making it a perfect complement to Salesforce's robust reporting.
Seamlessly integrating Salesforce reports with HubSpot CRM provides a two-fold advantage:
- First, it allows your team to leverage the full power of Salesforce's in-depth data analysis and reporting capabilities.
- Second, it combines this power with HubSpot's comprehensive view of customer interactions across multiple marketing, sales, and service touchpoints.
This holistic view of the customer journey means your team can make data-driven decisions that take into account the entire spectrum of a customer's interaction with your business. It enhances your ability to align marketing and sales strategies, create personalized customer experiences, and optimize your revenue generation processes.
The Takeaway
Having access to Salesforce reports is a valuable asset for any revenue team. These reports provide in-depth insights into customer behavior and allow for data-driven decisions to be made. However, the effectiveness of these reports relies heavily on the accuracy and completeness of the data within the CRM.
To ensure that Salesforce reports provide accurate findings, marketing and sales teams must be diligent in updating contact properties regularly. This includes keeping up-to-date with changes in customer behavior and preferences, as well as maintaining accurate information on leads and opportunities.
If you have been using Salesforce, you are likely familiar with the deep insights that Salesforce reports provide. But, if you're seeking a CRM that offers an exceptional user experience, seamless integration, and a more holistic view of your customer interactions, you might consider migrating from Salesforce to HubSpot CRM.
Beth Abbott
Beth is a Senior Manager of Revenue Operations at New Breed and specializes in optimizing how processes and platforms support revenue growth.


